
To benchmark a PC, run a standardized test on each component and compare the score to published baselines for the same hardware: Cinebench for the CPU, 3DMark for the GPU, and CrystalDiskMark for storage. A benchmark turns performance into a repeatable number that confirms a part meets its rated speed, validates an upgrade, and exposes problems such as thermal throttling. Monitor temperatures with HWiNFO during every run, and remember that a benchmark measures peak performance, while a stress test checks whether the system stays stable under sustained load. Avoid UserBenchmark for comparisons, because its scoring is widely criticized as biased.
Benchmarking a PC measures the performance of the CPU, GPU, and storage by running standardized tests and comparing the scores to baselines. A benchmark produces a repeatable number that quantifies a component’s speed, which confirms stability, compares hardware, and validates an upgrade. This article walks through benchmarking in phases ordered from purpose to comparison: understand why benchmarking matters, benchmark the CPU with Cinebench, benchmark the GPU with 3DMark, benchmark storage with CrystalDiskMark, run an in-game benchmark, monitor temperatures and clocks during the runs with HWiNFO, and compare the scores to online baselines.
The article also explains how thermal throttling lowers scores when a component overheats. Each phase states its goal and gives the exact steps. The result is a set of measured scores for the processor, graphics card, and drive, recorded alongside the temperatures during each run, ready to compare against published baselines for the same hardware to confirm the system performs as expected.
Which Tool Benchmarks Each Part of a PC?
Each component has a dedicated benchmark, and a separate class of tool tests stability rather than speed. Match the tool to the part you want to measure, then close background applications so running programs do not skew the score.
A monitoring tool such as HWiNFO runs alongside any of these to log temperature, clock speed, and power. Temperatures reaching the thermal limit lower scores, which the guide to monitoring CPU and GPU temps covers in full.
Why Does Benchmarking Matter?
Benchmarking matters because it confirms stability, compares hardware, and validates that an upgrade or build performs as expected. A benchmark turns performance into a repeatable number that reveals whether a component meets its rated speed. Benchmarking serves three purposes listed below:
- Stability testing runs a sustained load to confirm the system does not crash or throttle under stress.
- Hardware comparison measures a component against published scores for the same and competing hardware.
- Upgrade validation compares scores before and after a hardware change to confirm the upgrade delivers its expected gain.
A benchmark score below the published baseline for the same hardware signals a problem, such as thermal throttling, a misconfigured power setting, or a background process consuming resources. Comparing before-and-after scores validates an upgrade, confirming a new graphics card or processor delivers the expected gain. A score that disappoints despite strong parts can point to a mismatch the guide to CPU and GPU bottlenecks explains in detail.
How Do You Benchmark the CPU With Cinebench?
Benchmarking the CPU with Cinebench measures processor performance through a rendering test that produces a comparable score. Cinebench renders a 3D scene across all CPU cores and reports a multi-core and single-core score that compares directly against other processors. Follow these steps:

- Download Cinebench 2024 or R23 from Maxon, the tool’s developer. Cinebench 2024 uses the newer Redshift engine, so its scores do not compare to R23.
- Close background applications, since running programs consume CPU cycles and lower the score.
- Run the multi-core test, which loads every core and thread to measure full processor performance.
- Run the single-core test, which measures per-core performance relevant to many games and lightly threaded tasks.
Cinebench reports a multi-core score for full processor performance and a single-core score for per-core speed, both comparable against other processors. The multi-core score reflects rendering and productivity workloads, while the single-core score reflects gaming and lightly threaded tasks. A score below the published baseline for the same processor points to thermal throttling or a power limit, which the temperature monitoring step confirms.



How Do You Benchmark the GPU With 3DMark?
Benchmarking the GPU with 3DMark measures graphics performance through standardized tests with published baselines. 3DMark runs a graphics workload such as Steel Nomad or Time Spy and reports a score that compares against other graphics cards. Follow these steps:
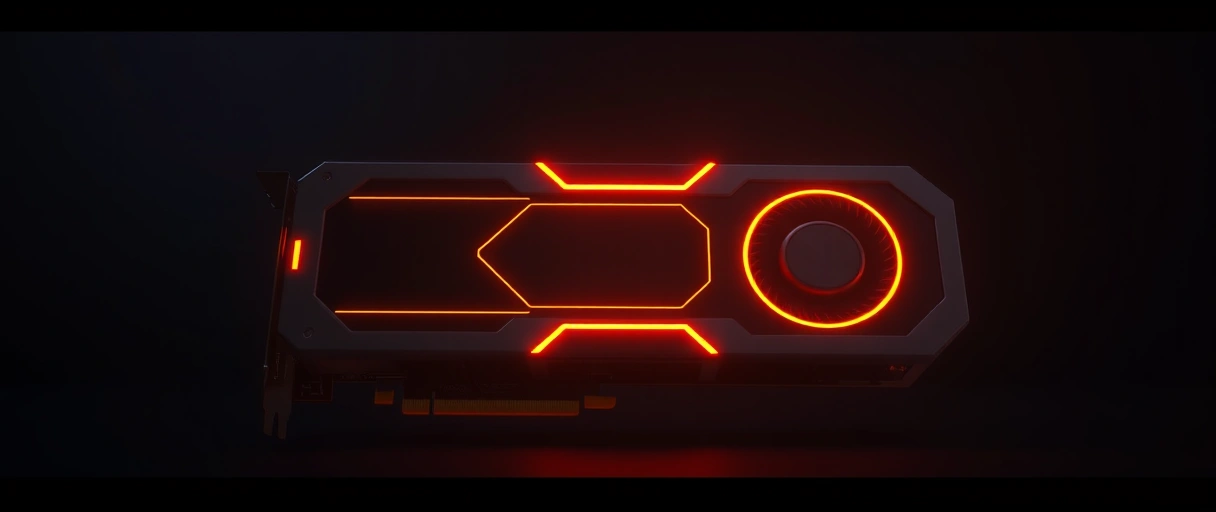
- Download 3DMark from UL Solutions, available on Steam and the developer’s site.
- Run Steel Nomad for a current high-end GPU test, which replaced Time Spy and runs about three times heavier at 4K.
- Run Time Spy for a DirectX 12 test at 1440p if your card is mainstream, since it still has the largest comparison database.
- Record the graphics score and overall score, then compare against the 3DMark database for the same card.
Steel Nomad is the heavier modern workload for current cards, while Time Spy remains a useful 1440p DirectX 12 test, both with large comparison databases. The graphics score isolates GPU performance from the processor, producing a number that compares directly against the same card. A GPU score below baseline points to thermal throttling or a driver issue; if your card runs cool but still trails, the guide to overclocking your GPU covers reclaiming headroom safely.
How Do You Benchmark Storage With CrystalDiskMark?
Benchmarking storage with CrystalDiskMark measures the read and write speeds of a drive in megabytes per second. CrystalDiskMark runs sequential and random transfer tests and reports the speeds, which confirm a drive performs at its rated specification. Follow these steps:
- Download CrystalDiskMark from its developer, then select the target drive.
- Run the default test, which measures sequential and random read and write speeds.
- Read the sequential speeds, which indicate large-file transfer performance such as copying video.
- Read the random 4K speeds, which indicate small-file performance relevant to system responsiveness.
CrystalDiskMark reports sequential speeds for large-file transfers and random 4K speeds for small files, with a SATA SSD reaching around 550 MB/s sequential and an NVMe PCIe 4.0 drive reaching 7,000 MB/s. The random 4K speed affects system responsiveness more than the sequential figure for everyday use. A drive below its rated speed signals a connection or configuration issue rather than a worn component.
How Do You Run an In-Game Benchmark?
Running an in-game benchmark measures real gaming performance in frames per second within an actual game. Many games include a built-in benchmark that runs a fixed scene and reports average, minimum, and maximum frame rates, which a synthetic score only estimates. Follow these steps:
- Open the graphics or display settings in a game with a built-in benchmark, such as Cyberpunk 2077 or Shadow of the Tomb Raider.
- Set the resolution and graphics preset to the settings the benchmark should measure.
- Run the built-in benchmark, which plays a fixed scene and records the frame rate.
- Record the average, minimum, and 1 percent low frame rates, which describe smoothness beyond the average alone.
An in-game benchmark measures real gaming performance at chosen settings, reporting the average, minimum, and 1 percent low frame rates that describe smoothness. The 1 percent low frame rate reveals stutters the average hides, since a high average with low minimums still feels uneven. A card can rank high in a synthetic test yet run a specific game differently, which is why the in-game result matters for the frames you actually see.
How Do You Monitor Temperatures and Clocks During Runs?
Monitoring temperatures and clocks during benchmark runs reveals whether thermal throttling lowers the scores. HWiNFO logs the temperature, clock speed, and power of the CPU and GPU during a benchmark, exposing throttling that caps performance. Follow these steps:
- Download HWiNFO and open the sensors view, which lists CPU and GPU temperature, clock speed, and power.
- Start logging in HWiNFO before the benchmark, which records the values across the run.
- Run the benchmark while watching the temperatures, noting whether the CPU or GPU reaches its thermal limit.
- Check whether the clock speed drops as temperature rises, which indicates thermal throttling capping performance.
A clock speed that drops as the temperature reaches the thermal limit indicates thermal throttling, where the component slows itself to avoid overheating. A CPU reaching around 95 degrees Celsius or a GPU near its limit throttles, lowering the benchmark score below baseline. Monitoring during the run identifies throttling as the cause of a low score, which the guide to monitoring CPU and GPU temps addresses through cooling.
How Do You Compare Scores to Online Baselines?
Comparing scores to online baselines confirms whether the system performs as expected for its hardware. Each benchmark publishes a database of scores for known hardware, against which a measured score reveals normal or below-normal performance. Follow these steps:
- Find the baseline for the exact hardware in the 3DMark database or the Cinebench comparison charts for your CPU and GPU model.
- Compare the measured score to the baseline, noting whether it falls within the expected range.
- Investigate a score more than 10 percent below baseline, which points to throttling, drivers, or background load.
- Record the scores for future comparison, establishing a reference that validates a later upgrade.
A score within a few percent of the published baseline confirms the hardware performs normally, while a score more than 10 percent below points to thermal throttling, outdated drivers, or background processes. Use the manufacturer and 3DMark databases for this, not UserBenchmark, whose results are widely disputed. Recording the scores establishes a reference that validates a future upgrade or flags a later regression.
Common Mistakes to Avoid
Benchmarking produces misleading scores when the system state is inconsistent or temperatures go unmonitored. The mistakes that distort benchmark results are listed below:
- Leaving background applications running consumes resources, so closing them produces a consistent score.
- Ignoring temperatures during the run hides thermal throttling, so HWiNFO monitors the thermal limit.
- Comparing scores across different test versions misleads, so the same benchmark version is used for comparison.
- Trusting UserBenchmark for CPU rankings skews the picture, so the 3DMark and Cinebench databases are used instead.
- Benchmarking on a laptop on battery caps performance, so the laptop stays plugged in for full clocks.
A benchmark score below baseline most often results from thermal throttling or background processes rather than faulty hardware, which monitoring temperatures and closing applications confirm. Comparing scores requires the same benchmark version, since Steel Nomad and Time Spy produce different numbers. A laptop on battery throttles to save power, so a plugged-in run measures full performance.
Last Thoughts on Benchmarking Your PC
Benchmarking a PC follows a fixed order: understand why benchmarking matters, test the CPU with Cinebench, the GPU with 3DMark Steel Nomad or Time Spy, and storage with CrystalDiskMark, run an in-game benchmark for real frames per second, monitor temperatures with HWiNFO, and compare the scores to online baselines for the same hardware. A benchmark measures peak performance, so pair it with a stress test such as Prime95 or FurMark when you need to confirm the system is also stable.
Thermal throttling lowers scores when a component overheats, so monitoring temperatures during each run explains a result below baseline, and a disputed source such as UserBenchmark is best avoided for comparisons. Readers can continue with the guide to monitoring CPU and GPU temps, the guide to overclocking your GPU, or the wider PC tutorials hub for the next step.
Key Takeaways:
- Benchmark the CPU with Cinebench, the GPU with 3DMark, and storage with CrystalDiskMark, then compare each score to baselines for the same hardware.
- Use Steel Nomad for current graphics cards, since it replaced Time Spy and runs about three times heavier.
- An in-game benchmark gives the real frames per second a synthetic score only estimates, and the 1 percent low frame rate reveals stutter the average hides.
- A benchmark measures peak performance, while a stress test such as Prime95 or FurMark confirms stability under sustained load.
- Monitor temperatures with HWiNFO, since thermal throttling lowers scores when a component reaches its thermal limit.
- Avoid UserBenchmark for comparisons, because its scoring is widely criticized as biased and is banned from major hardware communities.
Frequently Asked Questions (FAQs)
How do I benchmark my PC?
Test the CPU with Cinebench, the GPU with 3DMark Time Spy or Steel Nomad, and storage with CrystalDiskMark. Monitor temperatures with HWiNFO during each run, then compare the scores to online baselines for the same hardware.
What is the difference between a benchmark and a stress test?
A benchmark runs a fixed workload for a few minutes and reports a comparable score that measures peak performance. A stress test runs a maximum load for an hour or more and reports pass or fail, checking stability rather than producing a score. Tools such as Prime95 and FurMark are stress tests, not benchmarks.
Is UserBenchmark accurate?
UserBenchmark is widely criticized for a scoring formula that over-weights single-core performance and understates multi-core, which produces results that favor Intel over AMD. It is banned from the r/hardware and r/intel communities and restricted on r/AMD. Use 3DMark, Cinebench, and the manufacturer databases instead.
What 3DMark test should I use?
Use Steel Nomad for a current high-end DirectX 12 card, since it replaced Time Spy and runs about three times heavier. Time Spy still suits mainstream cards, and both have large databases to compare against the same GPU.
Why is my benchmark score low?
A low score usually means thermal throttling, outdated drivers, or background processes rather than faulty hardware. Monitor temperatures with HWiNFO during the run, close background applications, and confirm a laptop is plugged in, then compare to the baseline again.
Does an in-game benchmark matter more than a synthetic score?
An in-game benchmark measures the real frames per second you experience, which a synthetic score only estimates. A card can rank high in 3DMark yet run a specific game differently, so the in-game result and its 1 percent low frame rate describe playable smoothness better than a synthetic number alone.
About the author

Nizam Ud DeenFounder and Tech Blogger
Muhammad Nizam Ud Deen Usman is the founder of theCoreiTech and the author of The Local SEO Cosmos. He has worked in search since 2014 as an SEO consultant for eCommerce stores and local businesses, specialising in eCommerce SEO, local SEO and technical SEO, and runs SEO Academy and the SEO Community from Multan, Pakistan. He also founded ORM Digital Solutions, a digital agency serving medium and large businesses, and holds a degree from the University of Education, Lahore (Multan Campus). Plerdy lists him among its Best 20+ SEO Experts in Pakistan. Nizam started theCoreiTech in 2012 to make computers easier to understand and use for everyone. More of his work is at nizamuddeen.com.
